On Friday I returned, by jet-powered flying device, from Yet Another Visit To Berlin. :) Berlin still exudes cool like nothing else, and I got to spend my time there in the company of more than 190 other Visualisation people, many of whom have become friends over the past years. The three days were filled with presentations, but more importantly (sorry presenters!) good conversations, new friends (contacts?) and not too much sleep. This was, without a doubt, my best Eurovis conference so far!
The conference was held in the historically and scientifically significant Harnack House, located in the academia-dominated Dahlem district of Berlin. For a time, the Harnack House was the home of brilliant German scientists such as Einstein, the guy who invented the dish-washer (as you all know). The unique setting definitely contributed to the particularly unique feel of this year’s event.
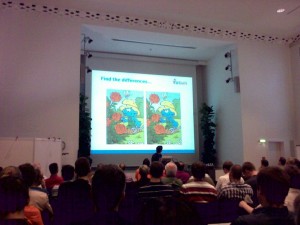
Stef did a sterling job presenting our paper on the scientific comparison of Smurfs (will add link to paper later):
In spite of the importance of Smurf comparison, the best paper award was awarded to our friends from Swansea for their work on the Visualisation of Sensor Data from Animal Movement! Remember to keep an eye out for our soon-to-appear InfoVis 2009 paper on the same topic, in cooperation with them.
Other papers / presentations that somehow stuck with me are (this is mostly due to my medvis bias and is not any reflection on the quality of the papers I do NOT list):
- Instant Volume Visualization using Maximum Intensity Difference Accumulation by Bruckner and Gröller (Vienna): By a continuous combination of DVR and MIP, this technique overcomes problems of both techniques. Minimal futzing with transfer functions, better depth than MIP, 35% improvement!
- Map Displays for the Analysis of Scalar Data on Cerebral Aneurysm Surfaces (no link available yet) by Neugebauer, Gasteiger, Beuing, Diehl, Skalej and Preim (Magdeburg): This is a great example of combining 3D with 2D to effectively visually represent complex simulation data. Also, much like our shoulder work, this is a text book example of the medical visualisation pipeline (acquisition, image processing, simulation / modelling, visualisation / interaction, evaluation).
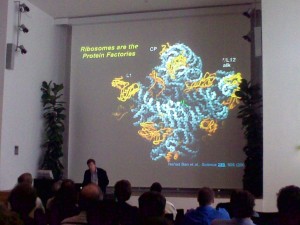
The capstone on Friday by Helmut Grubmüller on Watching Biomolecular Nanomachines at Work was inspiring. Besides the fact that he seems to publish papers with beautiful visualisations in Science every second week, he’s a fantastic speaker who was able to impress on us his wonder at these almost unfathomably tiny protein-component machines, with their rotating axes and all. Here’s another bad mobile phone photo of the man in action:
P.S. Of course our paper wasn’t really on Smurf comparison.
P.P.S. Petra Isenberg (winner of the 3d best paper award!) and Christopher Collins made a really cool and detailed write-up of Eurovis 2009 (slightly infovis-biased) at Information Aesthetics.

