Welcome all to the latest edition of the Weekly Head Voices! In a bid to get more numbers into my titles (oh who am I kidding, I’m clearly trying to slightly injure or preferably frighten two birds with a single stone, splitting infinitives as I go along), this WHV is dedicated to the EuroVis 2010 conference, which on its part is the reason I spent most of last week in Bordeaux.
Château Faugères, youngest of the chateaux. Photo by Peter Krekel.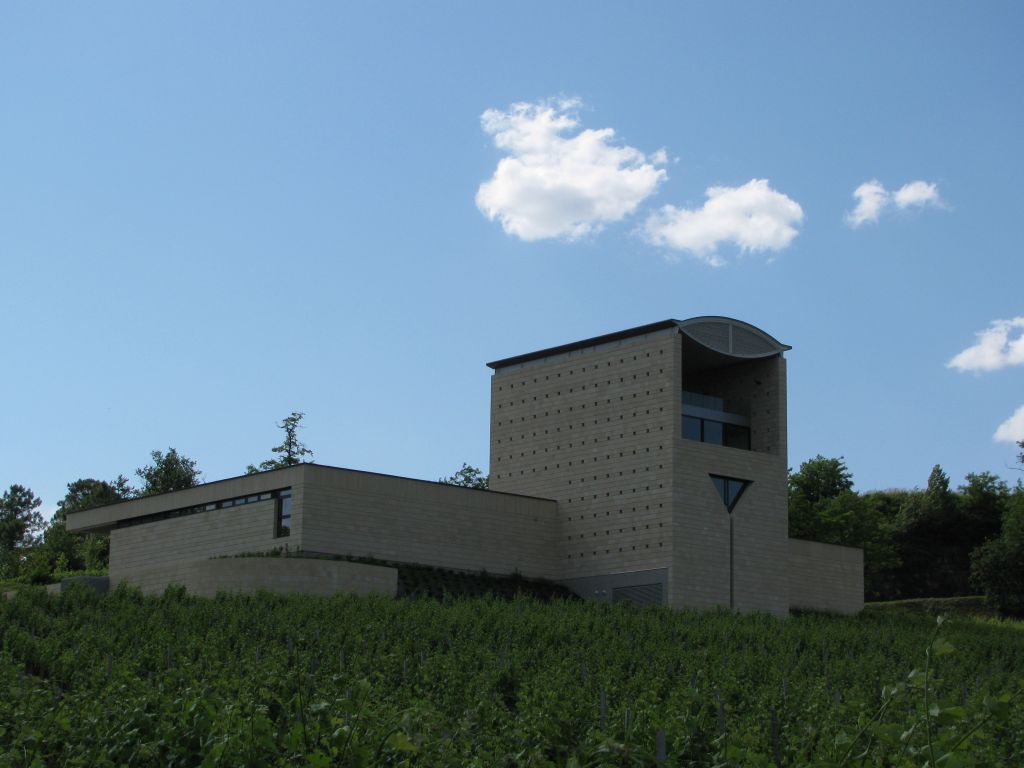
EuroVis is definitely the most important European scientific conference on Visualisation. For detailed and complete coverage, see T.J. Jankun-Kelly’s (he was also the uncontested tweetmaster of the conference) detailed blog posts on the first, second and third days of the conference. The post you are reading now is my very own extremely biased and mostly incomplete view of the conference and of conferences in general, which can sometimes be interesting. Or just very misleading.
Let’s start with the basics: A scientific conference is where a bunch of mostly scientists get together somewhere in the world, ostensibly to present recent results of their research to each other. Work certainly gets presented, and in some cases it’s a treat seeing a gifted orator giving a superb presentation.
However, in my mind the primary reason to go to a conference is not to discuss work that was submitted half a year ago, but to meet with colleagues and friends and to discuss important things, such as life, science in general and the research that has not yet been published or even started up yet. It is a hugely important element of the social goo that keeps a research field coherent and cooperative.
There are numerous overlapping interest and social groups that continuously split off to discuss something or just socialise, and then merge back into the larger group. The various attendees each has their own character and associated mode of operation: Some flit around, speaking to all and sundry, some stick to and act as the backbone of the subgroup that they belong to, some walk around and think, sometimes being approach by yet another type of agent. It’s interesting to watch from the corner of one’s eye whilst one is also enjoying taking part in this system. Sometimes the backyard anthropologist in me wonders how exactly the nature of this social fabric affects the performance of science. I imagine that it would be cool to put together a taxonomy of social conference types and even map their behaviour during a single conference such as this.
In any case, at EuroVis there were, the same as last year in Berlin, 190 attendees. Three days of presentations, with a poster session and a visit to Saint-Émilion thrown in for good measure.
With regard to the presentations, I seemed to notice an ever-so-slight upwards trend in the number of papers accompanied by open source software implementations (both MotionVA and ShapeSpaceExplorer by respectively our very own Peter Krekel and Stef Busking are open source, but there were more examples). This is really a great development, as it is an important component of the whole open science idea. With the implementations available, colleagues can reproduce one’s results and thus have a greater chance of being able to improve on them. Also, new implementations can be directly compared to existing ones, something which is currently incredibly hard.
Two of my favourite presentations were the following:
- Visual Support for Interactive Post-Interventional Assessment of Radiofrequency Ablation Therapy by Christian Rieder, Andreas Weihusen, Christian Schumann, Stephan Zidowitz, Heinz-Otto Peitgen: I really like this genre of solutions, where complex 3D problems are reduced to normalised 2D representations. A previous example is the work of Neugebauer et al. at EuroVis 2009. In this case, the authors presented “tumor maps”, a 2D map-style representation of the tumor and its surroundings which greatly facilitates the post-therapy tumor assessment. The fulltext paper will hopefully be linked on Christian’s website soon.
- Estimation and Modeling of Actual Numerical Errors in Volume Rendering by Joel Kronander, Jonas Unger, Anders Ynnerman, Torsten Möller: Although this is not my personal favourite type of research, I think the work (and work like it) is tremendously important. The authors meticulously measure the impact of different precision and sampling strategies on the volume rendering pipeline, and, as if that wasn’t enough, derive a mathematical model with which the role of these variables can be predicted in unseen volume rendering problems. In my view, this is a great example of research towards deriving elements of that elusive visualisation theory. Just to help ram the point home, the presentation was extremely well executed.
On a slightly higher level, what I’ve also started noticing is the different styles of visualisation. Many research groups have a distinct style of visually representing their data: One can easily recognise a Viennese design, and sometimes even notice how elements thereof have been subtly adapted by a faction of ex-Viennese scientists in Bergen. The Bergenesque style is still quite young, but will probably soon spread to different groups. Of course not all groups are that easy: Our own style is heterogeneous, although I’m glad to see at least the blue-to-yellow more-or-less perceptually linear colour-scale starting to permeate our work. It would still be interesting to start a kind of genealogical tree showing the various styles and also how they spread along with the persons practising them.
On the topic of Saint-Émilion: 1000 vineyards covering 95% of the available land, oldest of the vineyards 2000 years old, number of beautiful old Chateaux (castles man, castles!) each having on average 6 hectares of land. 5 different classes of wine produceds, ranging from 5 euros per bottle (hello there!) up to 7000 euros per bottle. It’s a beautiful piece of country. In fact, it reminded me very strongly of the Western Cape in South Africa,where I grew up.
My group ended up visiting Château Faugères, by far the youngest of the chateaux, but awesomely cool nonetheless, as it was designed by a Swiss-Italian architect by the awesomely cool name of Mario Botta. We got to taste one (1) wine. This was slightly less reminiscent of the vineyards of the Western Cape in South Africa, where one can taste wines until one starts developing very entertaining coordination problems. Fortunately, this very small oversight was more than compensated for by the subsequent visit to the town of Saint-Émilion, its monolithic church and the catacombs, all narrated by an extremely gifted and humorous guide, and finally by the marvelous concluding dinner, done as only the French can.
So kids, that it was it for this week’s lecture on Further Mystifying Scientific Conferences! I have to go, as I have to start thinking about the next Weekly Head Voices.